Summary
I wrote this code as a driver file for an 8" TFT LCD Touchscreen. It requires 8 inputs for the class: the pins for X+, X-, Y+, Y- from the FPC breakout board, as well as the length and width of the LCD Display on the touchscreen and the coordinates of the center of the touchscreen (Note: inputs for these can be in any unit system, as long as all are consistent). The code itself contains 4 methods which are used to track the coordinates of any input to the touchscreen:
- Xscan(): Returns the X coordinate of the input to the touchscreen. If there is no X input, then it returns None.
- Yscan(): Returns the Y coordinate of the input to the touchscreen. If there is no Y input, then it returns None.
- Zscan(): Returns a boolean output which measures if there is an input to the touchscreen. (1 = no input, 0 = input).
- coord(): Returns the touch input as a coordinate system and the response time. Returns in the format: (X, Y, Z), time [us].
The code has been designed to account for the settling time induced within the circuit between the touchpanel and the microcontroller and includes a moving average filter to dampen any spikes during data collection. I have optimized the structure of the code to return the coordinates of the touch input at around 1200us, which fulfills the 1500us requirement for this lab. See (Response Time Verification) for more information.
Hardware Setup
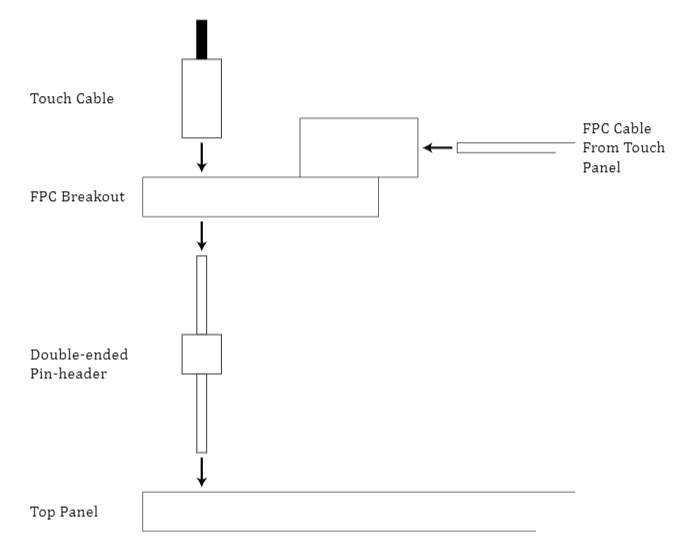
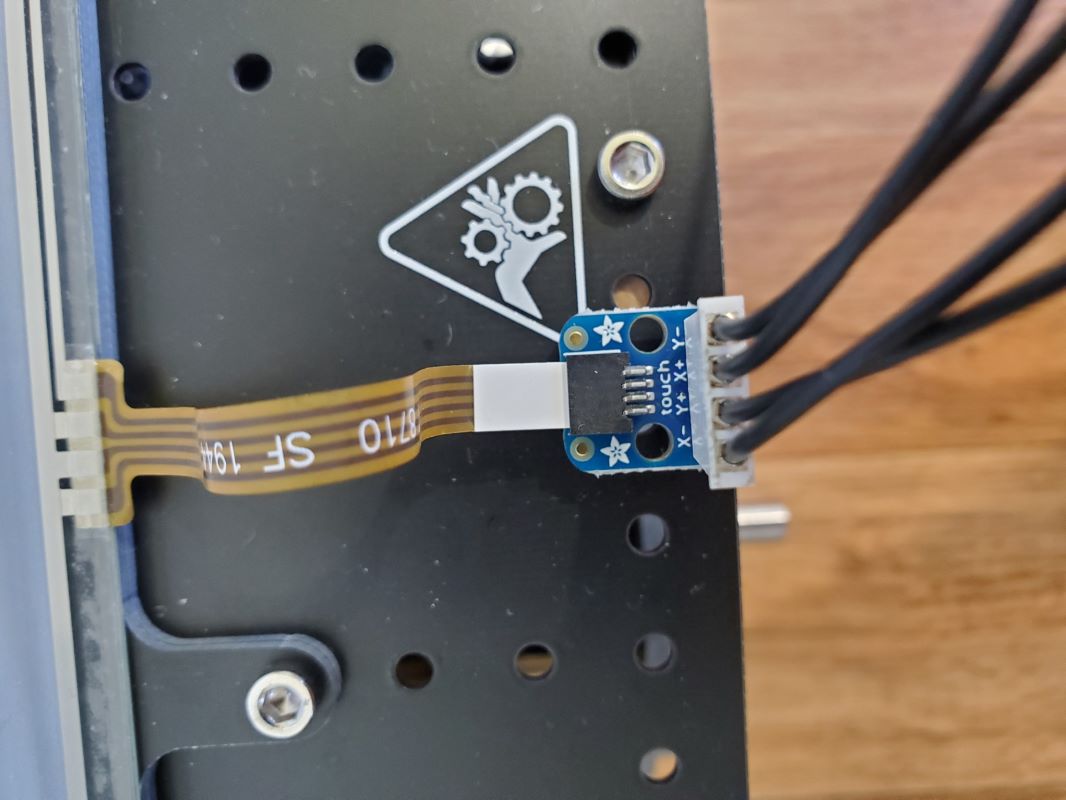
This section details how I have configured my hardware. I have soldered the FPC breakoutboard to the hardware as shown in the diagram below.
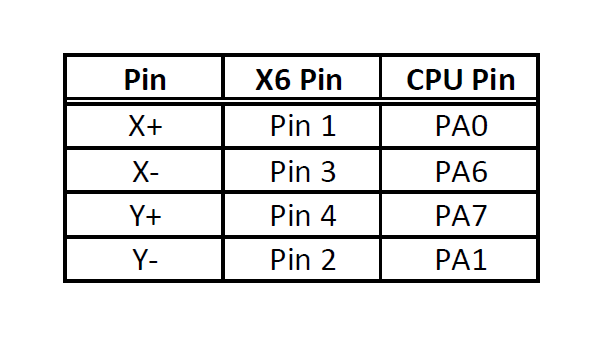
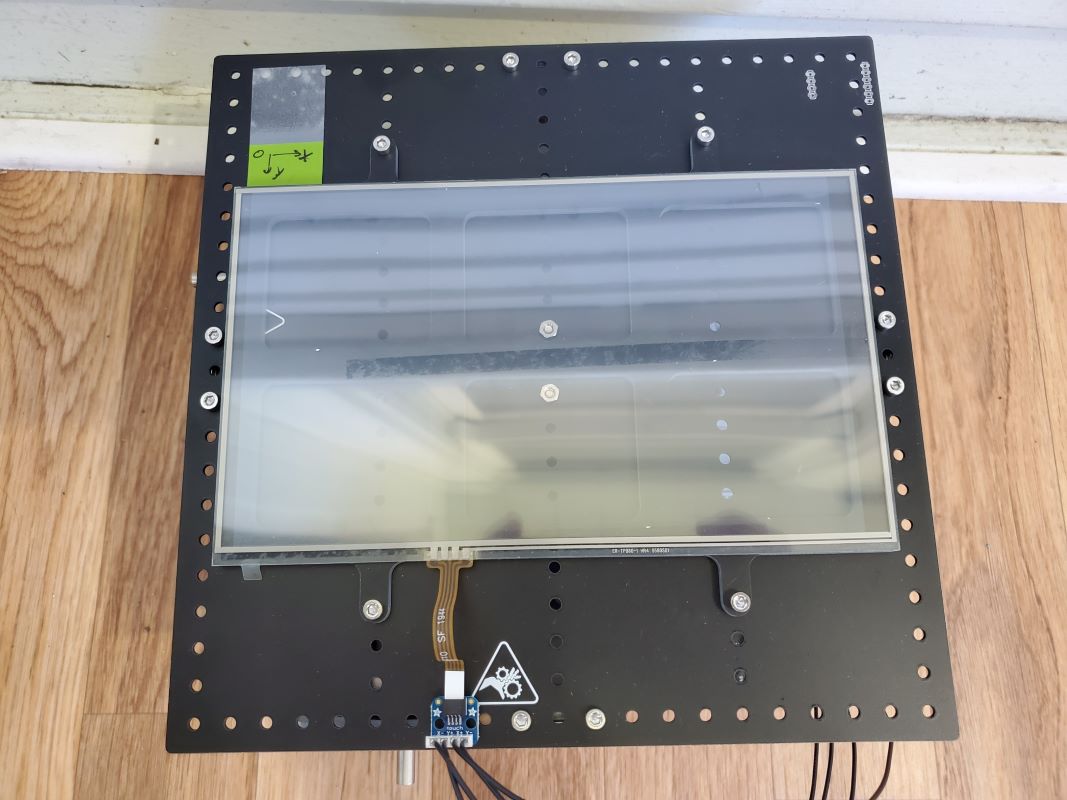
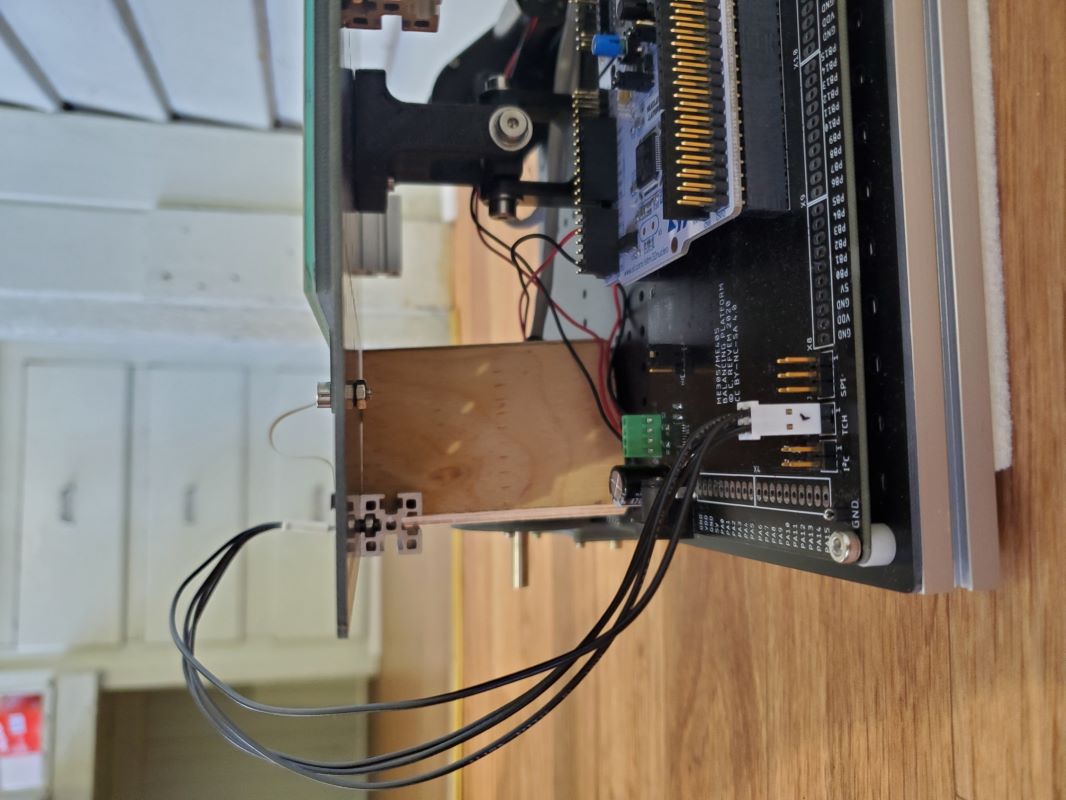
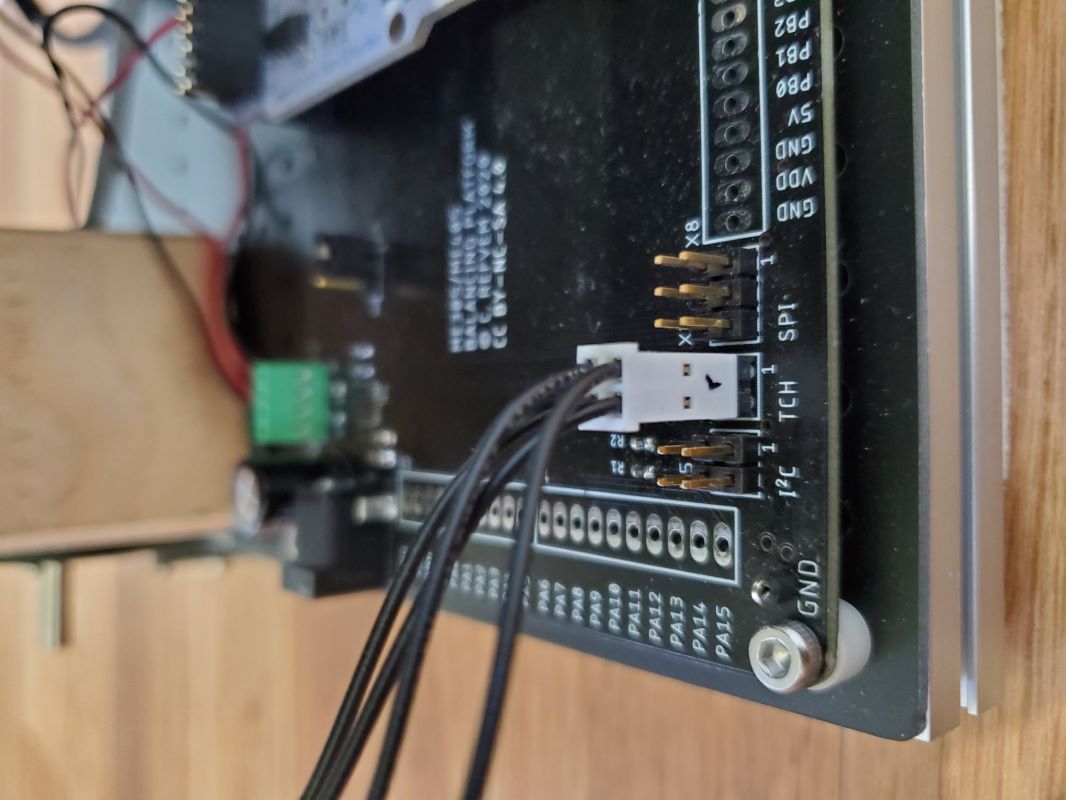
Here are some pictures which display my personal setup. I have configured it as shown in the data table below.
- Top View
-
- Side View
-
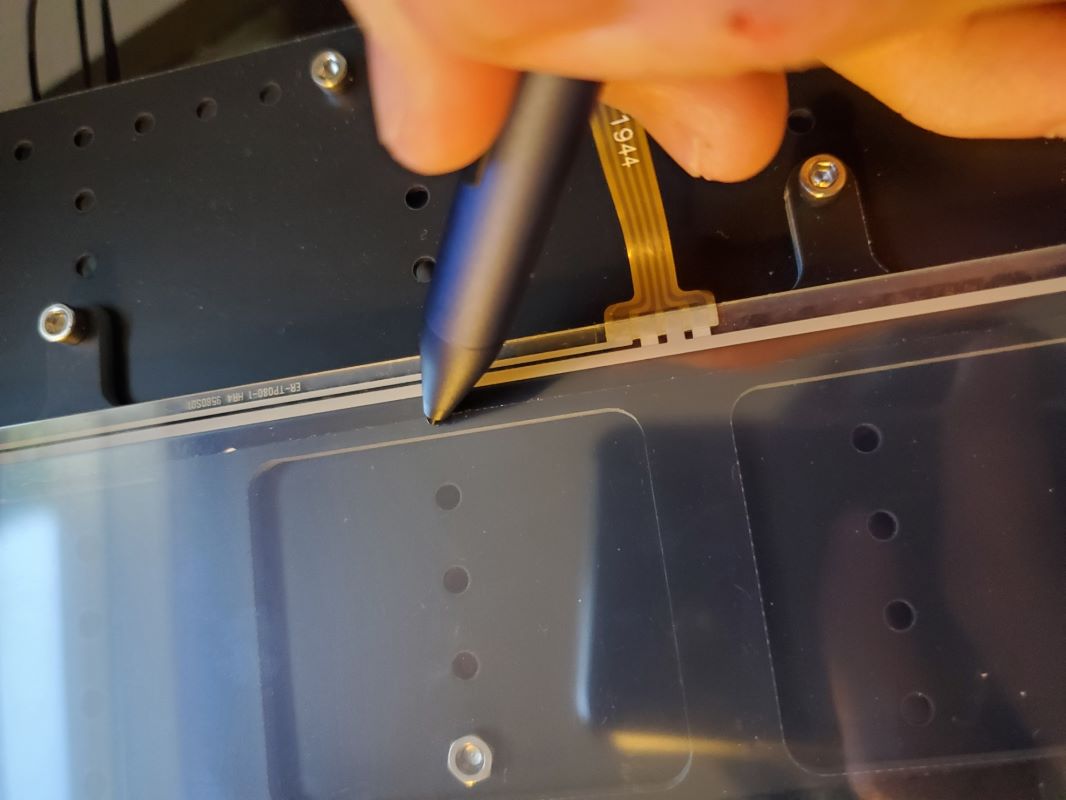
FPC Detail View:
TCH Pin X6 Detail View:
Code Testing and Verification
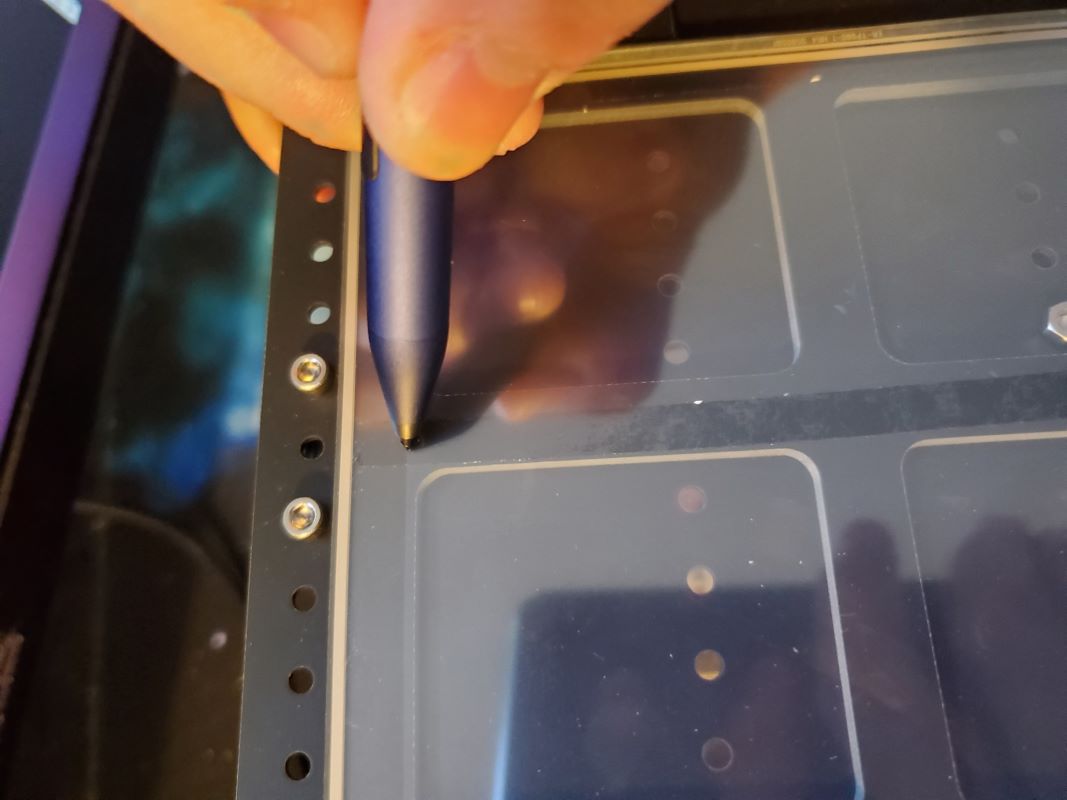
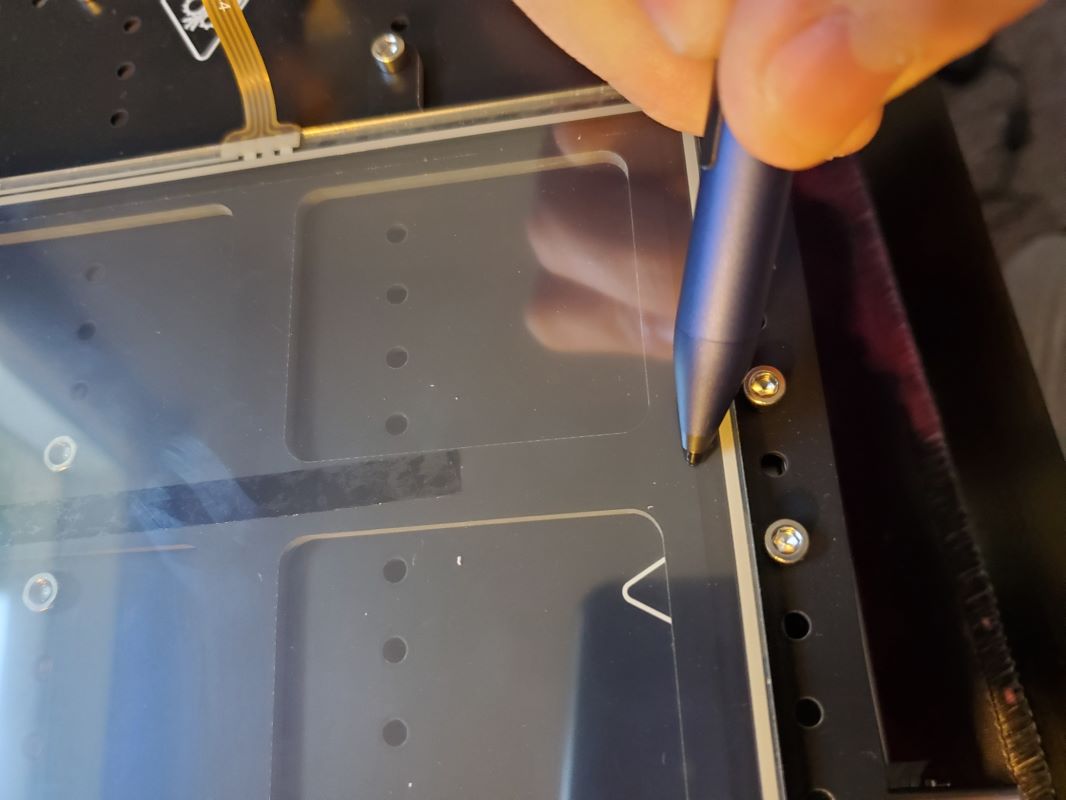
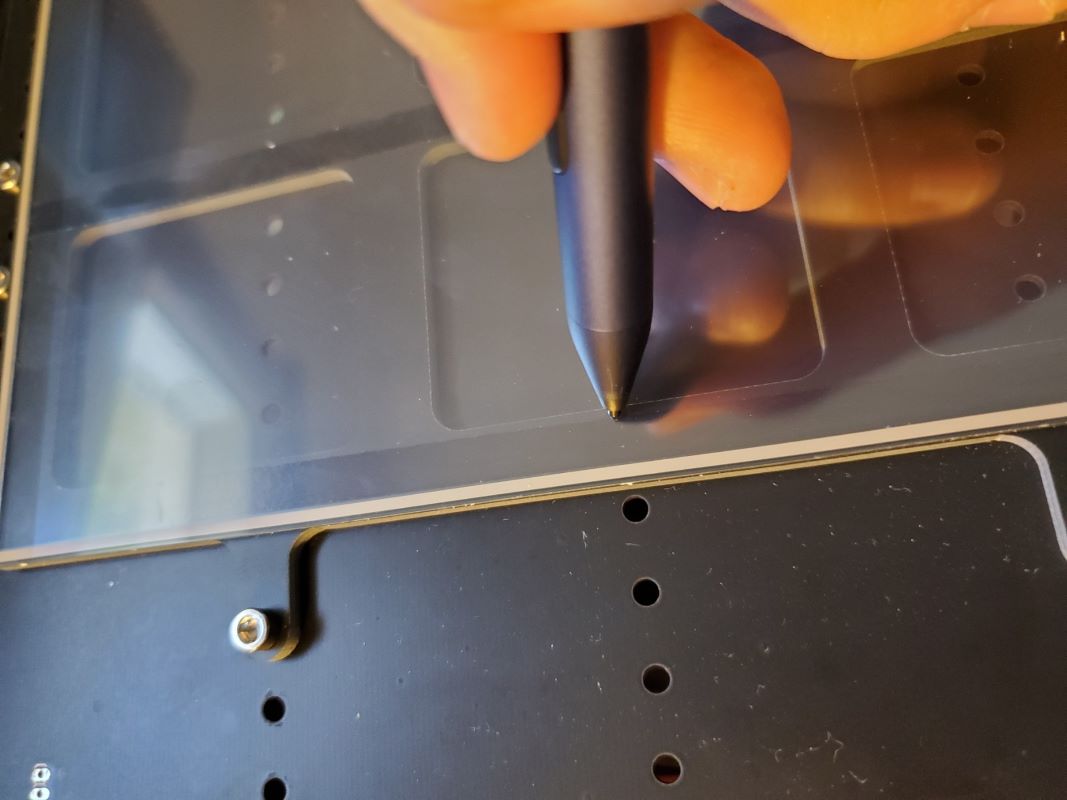
This section exhibits how I tested my code to verify that it accurately tracks the input to the touch panel. In the first test, I needed a way to verify that the touchscreen coordinates accurately reflect the input. I debated using a ruler or physical scale, however, it would be difficult to provide an accurate measurement since there is no easy way to measure in the same coordinate system as the code. Instead, I chose to test the bounds at each axis. Since we know the size of the LCD Display from the manufacturer, the coordinates that my code spits out should result in readings that are half of the LCD Display dimensions (176.64mm x 99.36mm). The LCD display can be seen in each picture by looking for the change in opacity of the touchscreen, near my pen cursor. The results are shown below:
- Positive X
- From the data sheet, we should expect the result to be 176.64mm/2 = 88.32mm. My code underestimates this value slightly (averaging around 87.5mm at the boundary), which I have deemed as an acceptable tolerance.
Results from the trial:
(87.07801, 1.343109, 0)
(87.64546, 0.7783966, 0)
(87.64546, 0.8241768, 0)
(87.59612, 1.007332, 0)
(87.57144, 0.9310188, 0)
(87.57144, 0.732605, 0)
(87.44807, 0.808918, 0)
(87.39873, 1.05312, 0)
(87.30005, 1.129429, 0)
(87.39873, 0.9920731, 0)
(87.44807, 0.8699722, 0)
(87.30005, 0.9615479, 0)
(87.27538, 0.9920731, 0)
(87.44807, 0.9462776, 0)
(87.39873, 0.7936554, 0)
(87.15201, 0.7478714, 0)
(87.2507, 0.5189285, 0)
(87.37407, 0.2899933, 0)
(87.42342, 0.4120941, 0)
(87.49743, 0.5494537, 0)
(87.49743, 0.6715546, 0)
(87.5221, 0.6868172, 0)
(87.39873, 0.3815727, 0)
- Negative X
- From the data sheet, we should expect the result to be -176.64mm/2 = -88.32mm. My code underestimates this value slightly (averaging around -88mm at the boundary), which I have deemed as an acceptable tolerance.
Results from the trial:
(-88.04639, 1.648354, 0)
(-88.07106, 1.633095, 0)
(-88.09573, 1.648354, 0)
(-88.2191, 1.770454, 0)
(-88.16975, 1.648354, 0)
(-88.09573, 1.480473, 0)
(-88.07106, 1.66362, 0)
(-87.97236, 1.709408, 0)
(-88.09573, 1.602573, 0)
(-88.31779, 1.526253, 0)
(-88.34246, 1.572048, 0)
(-88.24376, 1.449947, 0)
(-88.09573, 1.373631, 0)
(-88.07106, 1.449947, 0)
(-88.19442, 1.449947, 0)
(-88.2191, 1.480473, 0)
(-88.2931, 1.434677, 0)
(-88.34246, 1.434677, 0)
(-88.31779, 1.297318, 0)
(-88.36713, 1.17522, 0)
(-88.46581, 1.17522, 0)
(-88.46581, 1.159954, 0)
(-88.53984, 1.17522, 0)
(-88.58917, 1.159954, 0)
(-88.56451, 0.9768066, 0)
(-88.86058, 0.7631302, 0)
- Positive Y
- From the data sheet, we should expect the result to be 99.36mm/2 = 49.68mm. My code overestimates this value slightly (averaging around 50mm at the boundary), which I have deemed as an acceptable tolerance.
Results from the trial:
(1.3909, 49.67949, 0)
(1.020813, 50.01527, 0)
(0.9714737, 50.07632, 0)
(0.7987747, 49.93895, 0)
(0.6013947, 50.07632, 0)
(0.7247543, 50.2442, 0)
(0.7247543, 50.42736, 0)
(0.7494278, 50.33578, 0)
(0.7247543, 50.03053, 0)
(0.9221268, 50.12211, 0)
(1.020813, 50.19841, 0)
(0.8481216, 50.01527, 0)
(0.7987747, 50.01527, 0)
(0.9221268, 49.95422, 0)
(0.9961472, 50.04579, 0)
(0.9468002, 50.07632, 0)
(0.8974686, 50.0, 0)
(1.020813, 50.06105, 0)
(1.14418, 50.04579, 0)
(0.9468002, 50.0, 0)
(0.8727798, 49.80159, 0)
(0.9221268, 49.90842, 0)
(0.9221268, 50.13737, 0)
(0.9468002, 50.04579, 0)
(0.9221268, 49.89316, 0)
(0.9714737, 49.95422, 0)
- Negative Y
- From the data sheet, we should expect the result to be -99.36mm/2 = -49.68mm. My code underestimates this value slightly (averaging around -49.5mm at the boundary), which I have deemed as an acceptable tolerance.
Results from the trial:
(0.2806473, -49.69475, 0)
(0.3793335, -49.55739, 0)
(0.3793335, -49.55739, 0)
(0.5273743, -49.42003, 0)
(0.5027008, -49.43529, 0)
(0.4780273, -49.49634, 0)
(0.6013947, -49.48108, 0)
(0.4533539, -49.57265, 0)
(0.2806473, -49.58791, 0)
(0.2806473, -49.66423, 0)
(0.2066269, -49.6337, 0)
(0.1819534, -49.48108, 0)
(0.1326065, -49.5116, 0)
(0.1572952, -49.57265, 0)
(0.1819534, -49.58791, 0)
(0.2066269, -49.46581, 0)
(0.2559738, -49.40476, 0)
(0.1326065, -49.54213, 0)
(0.1079483, -49.55739, 0)
(0.08325958, -49.55739, 0)
(-0.01541901, -49.55739, 0)
(-0.01541901, -49.57265, 0)
(-0.04009247, -49.54213, 0)
(-0.08943939, -49.45055, 0)
(-0.2128067, -49.57265, 0)
(-0.1634598, -49.6337, 0)
Response Time Verification
This section exhibits how I tested my code to verify that I can calculate the positional coordinates in under 1500us. I developed the code below which is used to calculate the average response time for 1000 data points. From multiple trials, I determined that the average response time to read from all three channels is 1196.532us, which satisfies the speed requirements for this lab.
xp = Pin.cpu.A0
xm = Pin.cpu.A6
yp = Pin.cpu.A7
ym = Pin.cpu.A1
w = 100
l = 176
xc = l/2
yc = w/2
ts = touchscreen(xp, xm, yp, ym, w, l, xc, yc)
CODE FOR TESTING AVERAGE RESPONSE TIME:
avg_t = []
for i in range(1000):
start_time = utime.ticks_us()
ts.coord()
end_time = utime.ticks_us()
total_time = utime.ticks_diff(end_time, start_time)
avg_t.append(total_time)
avg = sum(avg_t)/len(avg_t)
print('Average Response Time for 1000 runs: ' + str(avg) + ' us')
- Author
- Kyle Chuang
- Date
- March 1,2021